TL;DR
- Node.js guide using Scrapingdog to pull Google Trends, then export CSV with
fast-csvand plot a PNG chart viachartjs-node-canvas. - Example: “Air purifier” in India (2021–2026); code fetches time series and saves
trends_chart.png. - Insight: interest rises in Sep and peaks around Nov; highest in Nov 2024.
- Includes ready code and a 1,000-credit free trial to test.
The world is moving very fast and analyzing trends becomes very crucial. No matter what industry you work in, if you have real-time trends data it can give you a competitive advantage over others.
Google Trends provides in-depth data on any trend around the globe. It collects this data through Google Search Results. If you want to prepare a report on growing trends within multiple industries, scraping Google Trends would be quite efficient for building reports.
This article will scrape Google Trends data using Nodejs and Scrapingdog’s Google Trends API.
Setup & Installation
For extracting trends data we are going to use Nodejs. If it is not installed on your machine, you can download it here.
Then create a folder by any name you like.
					mkdir trends
cd trends
Initialize the package.json file to establish a node project and create a js file. I am naming the file as trends.js.
npm init
Now, we have to install four libraries that will be used in the course of this article.
npm i axios fs chartjs-node-canvas fast-csv
axiosis for making an HTTP connection with the API.fsis for reading the JSON data received from the API.chartjs-node-canvasgenerates the graph usingChart.js.fast-csvsaves the data to a CSV file.
The final step would be to sign up for the trial pack of Scrapingdog. The trial pack comes with 1000 free credits that can be used for testing any API from Scrapingdog.
Scraping Google Trends with Nodejs
Let’s say you work in a consumer electronic manufacturing sector and you want to analyze whether the usage of Air purifier will going to increase or not. To analyze consumer interests and demands we will scrape the trends data.
Here’s a small video go through on how you can use Scrapigndog to scrape Google Trends.
Before we start coding, it would be great to read the documentation. This will help us understand the role of every parameter. We are going to analyze the trends of the keyword Air Purifier from 01 January 2021 to 01 January 2026 in India.
Let’s dive into our Scrapingdog’s dashboard and fill in the fields.
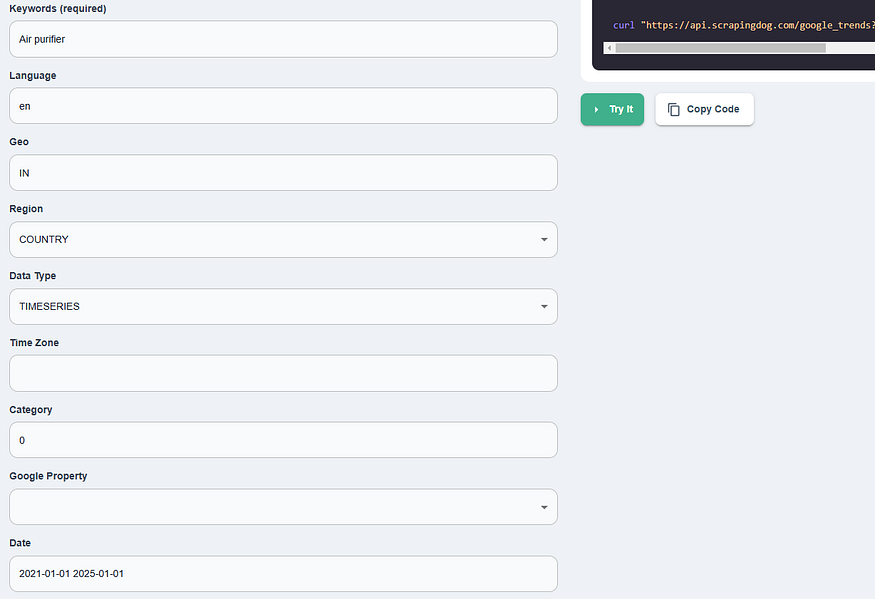
The best part is that after filling out the form you will get a ready-made code on the right.
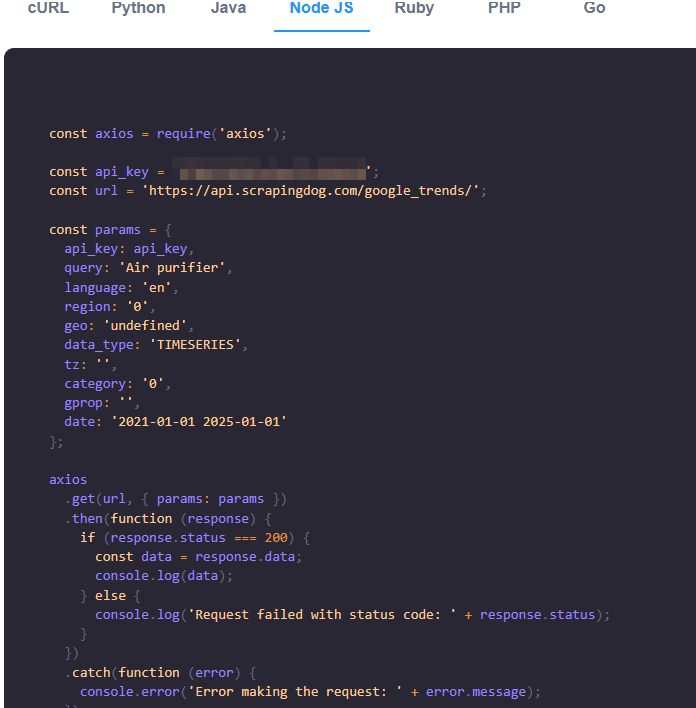
Just copy this code and paste it into your working environment.
					//trends.js

const axios = require('axios');

const api_key = 'Your-API-Key';
const url = 'https://api.scrapingdog.com/google_trends/';

const params = {
  api_key: api_key,
  query: 'Air purifier',
  language: 'en',
  geo: 'IN',
  region: '0',
  data_type: 'TIMESERIES',
  tz: '',
  cat: '0',
  gprop: '',
  date: '2021-01-01 2025-01-01'
};

axios
  .get(url, { params: params })
  .then(function (response) {
    if (response.status === 200) {
      const data = response.data;
      console.log(data);
    } else {
      console.log('Request failed with status code: ' + response.status);
    }
  })
  .catch(function (error) {
    console.error('Error making the request: ' + error.message);
  });
The code is very simple but let me explain you step by step.
If you see the params object you will find that we have almost passed 10 parameters. Let me explain to you the meaning of each parameter.
api_keyis the API key for your Scrapingdog account.queryis the term you want to search for.languageis the language of the result.geois the country you are targeting.regionis the place you are targeting using thegeoparameter.data_typedefines the type of search you want to do.tzis the time zone.catis used for defining the search category.gpropis used to sort results by property.dateis the date range.
If you run this code you will get this data.
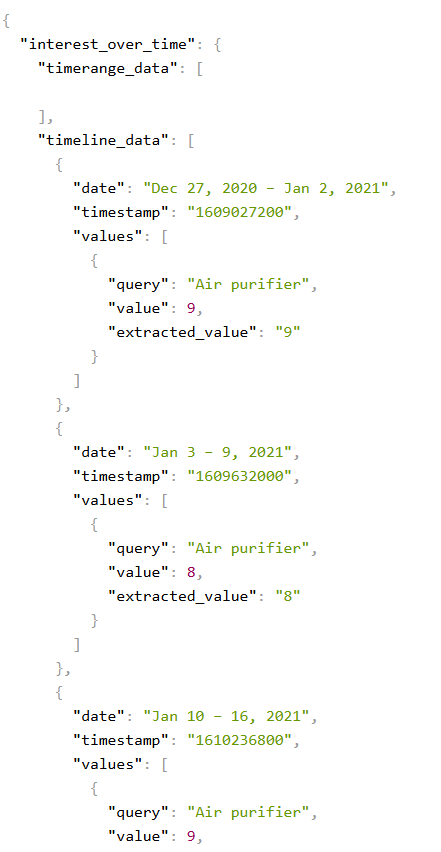
According to Google Trends, value means this…
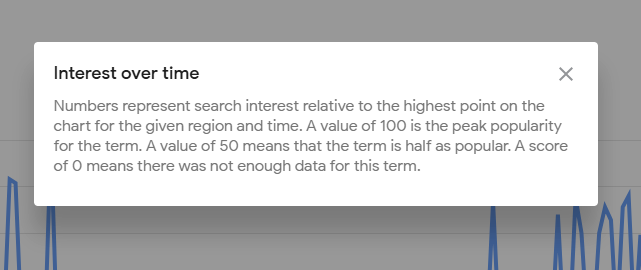
That means higher the value of value higher the demand.
Analyze the trends
Let’s plot a graph using chartjs-node-canvas. This will help us visualize the demand. We have to modify the code a little to make it the code look more readable.
					const axios = require('axios');
const fs = require("fs");
const { ChartJSNodeCanvas } = require("chartjs-node-canvas");
const fastCsv = require("fast-csv");
const path = require("path");

let data;
const api_key = 'your-api-key';
const url = 'https://api.scrapingdog.com/google_trends/';

const params = {
  api_key: api_key,
  query: 'Air purifier',
  language: 'en',
  geo: 'IN',
  data_type: 'TIMESERIES',
  tz: '',
  category: '0',
  gprop: '',
  date: '2021-01-01 2025-01-01'
};
let TrendsData

async function fetchData() {
  try{
    TrendsData = await axios.get(url, { params: params })
    if (TrendsData.status === 200) {
      data = TrendsData.data["interest_over_time"]["timeline_data"];
      let dates = data.map(entry => entry["date"]);
      let values = data.map(entry => parseInt(entry["values"][0]["value"]));
      console.log("Data is Extracted, now ploting the graph");

      let graphStatus = await generateChart(dates,values)
      if(graphStatus){
        console.log('graph plotting is complete')
      }


    } else {
      console.log('Request failed with status code: ' + TrendsData.status);
    }
  }catch(err){
    console.error('Error making the request: ' + err.message);
  }
}


async function generateChart(dates,values) {
      const width = 800;
      const height = 400;

      const chartCanvas = new ChartJSNodeCanvas({ width, height });

      const configuration = {
          type: "line",
          data: {
              labels: dates,
              datasets: [
                  {
                      label: "Search Interest in 'Air Purifier'",
                      data: values,
                      borderColor: "blue",
                      fill: false,
                      tension: 0.3,
                  },
              ],
          },
          options: {
              responsive: false,
              plugins: {
                  title: {
                      display: true,
                      text: "Google Trends: Air Purifier Search Interest Over Time",
                      font: { size: 16 },
                  },
              },
              scales: {
                  x: { title: { display: true, text: "Date" } },
                  y: { title: { display: true, text: "Search Interest" } },
              },
          },
      };

      // Generate and save chart as an image
      const imagePath = path.join(__dirname, "trends_chart.png");
      const imageBuffer = await chartCanvas.renderToBuffer(configuration);
      fs.writeFileSync(imagePath, imageBuffer);

      console.log(`Chart saved as ${imagePath}`);
      return true
  }

fetchData()
After data extraction is over we call the generateChart function. After setting the height and width of the graph we are creating an object that will design the graph. Once the plotting is done we save the graph as a PNG file by the name trends_chart.png.
Let’s run the code and see what it looks like.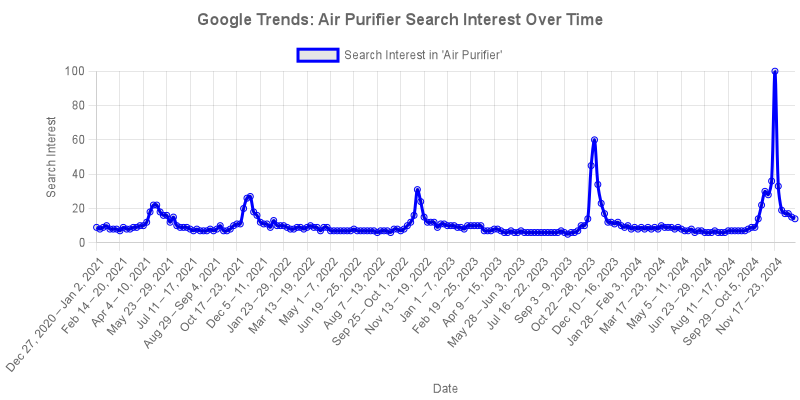
It clearly shows that trends started picking up after September 2024 and peaked around November 2024. If you notice the entire graph you will notice that the graph peaks around the same time interval. It starts growing by September and peaks in the month of November.
Key Findings:
- Highest Search Interest: 100 (Peak in November 2024)
- Lowest Search Interest: 5 (Observed in September 2023)
- Average Search Interest: 10.98 across all data points
Storing the data into a CSV file
Here we will use fast-csv library to simply store the data into a CSV file.
					const axios = require('axios');
const fs = require("fs");
const { ChartJSNodeCanvas } = require("chartjs-node-canvas");
const fastCsv = require("fast-csv");
const path = require("path");

let data;
const api_key = 'your-api-key';
const url = 'https://api.scrapingdog.com/google_trends/';

const params = {
  api_key: api_key,
  query: 'Air purifier',
  language: 'en',
  geo: 'IN',
  data_type: 'TIMESERIES',
  tz: '',
  category: '0',
  gprop: '',
  date: '2021-01-01 2025-01-01'
};
let TrendsData

async function fetchData() {
  try{
    TrendsData = await axios.get(url, { params: params })
    if (TrendsData.status === 200) {
      data = TrendsData.data["interest_over_time"]["timeline_data"];
      let dates = data.map(entry => entry["date"]);
      let values = data.map(entry => parseInt(entry["values"][0]["value"]));
      console.log("Data is Extracted, now ploting the graph");

      let graphStatus = await generateChart(dates,values)
      if(graphStatus){
        console.log('graph plotting is complete')
      }

      let csvStatus = await saveCSV(dates,values)
      if(csvStatus){
        console.log('CSV file is created')
      }
    } else {
      console.log('Request failed with status code: ' + TrendsData.status);
    }
  }catch(err){
    console.error('Error making the request: ' + err.message);
  }
}


async function generateChart(dates,values) {
      const width = 800;
      const height = 400;

      const chartCanvas = new ChartJSNodeCanvas({ width, height });

      const configuration = {
          type: "line",
          data: {
              labels: dates,
              datasets: [
                  {
                      label: "Search Interest in 'Air Purifier'",
                      data: values,
                      borderColor: "blue",
                      fill: false,
                      tension: 0.3,
                  },
              ],
          },
          options: {
              responsive: false,
              plugins: {
                  title: {
                      display: true,
                      text: "Google Trends: Air Purifier Search Interest Over Time",
                      font: { size: 16 },
                  },
              },
              scales: {
                  x: { title: { display: true, text: "Date" } },
                  y: { title: { display: true, text: "Search Interest" } },
              },
          },
      };

      // Generate and save chart as an image
      const imagePath = path.join(__dirname, "trends_chart.png");
      const imageBuffer = await chartCanvas.renderToBuffer(configuration);
      fs.writeFileSync(imagePath, imageBuffer);

      console.log(`Chart saved as ${imagePath}`);
      return true
  }

async function saveCSV(dates,values) {
    const csvPath = path.join(__dirname, "air_purifier_trends.csv");
    const writeStream = fs.createWriteStream(csvPath);
    const csvStream = fastCsv.format({ headers: true });

    csvStream.pipe(writeStream);
    dates.forEach((date, index) => {
        csvStream.write({ Date: date, Interest: values[index] });
    });

    csvStream.end();

    console.log(`CSV saved at ${csvPath}`);

    return true;
}


fetchData()
Here we will use fast-csv library to simply store the data into a CSV file.
fs.createWriteStream(csvPath) creates a writable stream to write data to the CSV file. Pipes (.pipe()) the formatted CSV data into the writable file stream (writeStream), allowing for efficient data writing.
Once you run the code you will see a CSV file inside your folder.
Observations
🔹Marketing & Sales Timing:
- The best time to promote air purifiers is October–December when search interest is at its highest.
- Advertising campaigns should be intensified in September to capture early buyers before peak demand.
🔹 Content Strategy for SEO:
- Publish seasonal blog posts about air quality concerns and solutions before the peak season (August–September).
- Focus on health benefits, pollution reports, and expert recommendations in October–November.
🔹 Product Launches & Discounts:
- Introduce limited-time promotions in October-November to capitalize on peak interest.
- Offer special bundles or discounts around Black Friday and Cyber Monday.
Here are Some Key Takeaways:
You can automate Google Trends data collection using Node.js instead of manually checking trends in the browser.
The guide provides a working Node.js script to fetch trend data and export it into a CSV file for analysis.
It demonstrates how to extract different types of trend insights, such as interest over time and regional interest.
Automating Google Trends scraping helps in building keyword research reports and spotting rising trends faster.
The tutorial is designed to help developers integrate trend data directly into their own tools and workflows.
Conclusion
Tracking Google Trends data for ‘Air Purifier’ searches provides valuable insights into consumer behavior, seasonal demand, and market opportunities. By leveraging Scrapingdog’s Google Trends API and automating data extraction with Node.js, we successfully visualized the search interest over time.
By storing and analyzing Google Trends data, businesses can predict consumer demand, refine their marketing efforts, and stay ahead of competitors. Future improvements could include correlating this data with pollution levels, e-commerce sales, or weather patterns to gain deeper insights.
Frequently Asked Questions (FAQs)
1: How can I scrape Google Trends data using Node.js?
You can scrape Google Trends using Node.js by integrating the Scrapingdog API. Fetch trends data for any keyword, export it to a CSV file, and visualize it using libraries like Chart.js or chartjs-node-canvas.
2: Do I need an API key to scrape Google Trends with Scrapingdog?
Yes, Scrapingdog requires an API key. Sign up for a free trial to get 1000 credits, which allows you to test scraping Google Trends and integrate it with your Node.js projects.
3: What are the benefits of scraping Google Trends data for businesses?
Scraping Google Trends helps businesses identify seasonal demand, track consumer interests, optimize marketing campaigns, and make data-driven decisions to stay ahead of competitors.